
Prints (0)
-
No Prints Yet
Be the first to upload a Print for this Design!
Description
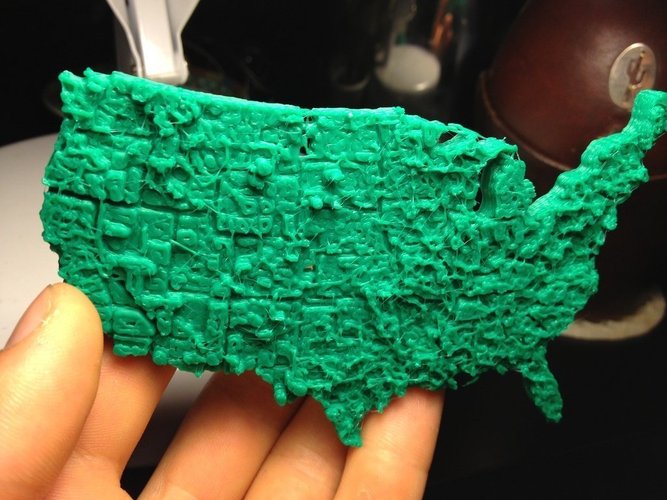
SummaryFor my long paper in my computational economics class I decided to do economic data visualization using my 3d printer. I took an unemployment map of the US by county in 2009 and turned it into a 3d object with the unemployment level displayed by relative height. It also functions as an accurate pocket map of the US.InstructionsPrinted with 40% infill. PLA/ABS works. The STL scales decently so feel free to print in any dimensions, I would suggest calibrating your E-retraction length because it will have strands if it isn't perfect. It would be really cool if someone else printed this before I turn in my paper on Friday, I would totally put that in the paper! Javascript I used can be found here: http://www.thingiverse.com/thing:15276 Economic Data was taken from the Bureau of Labor Statistics and the image can be found here: http://flowingdata.com/wp-content/uploads/2012/01/Unemployment-choropleth-425x278.png
Comments